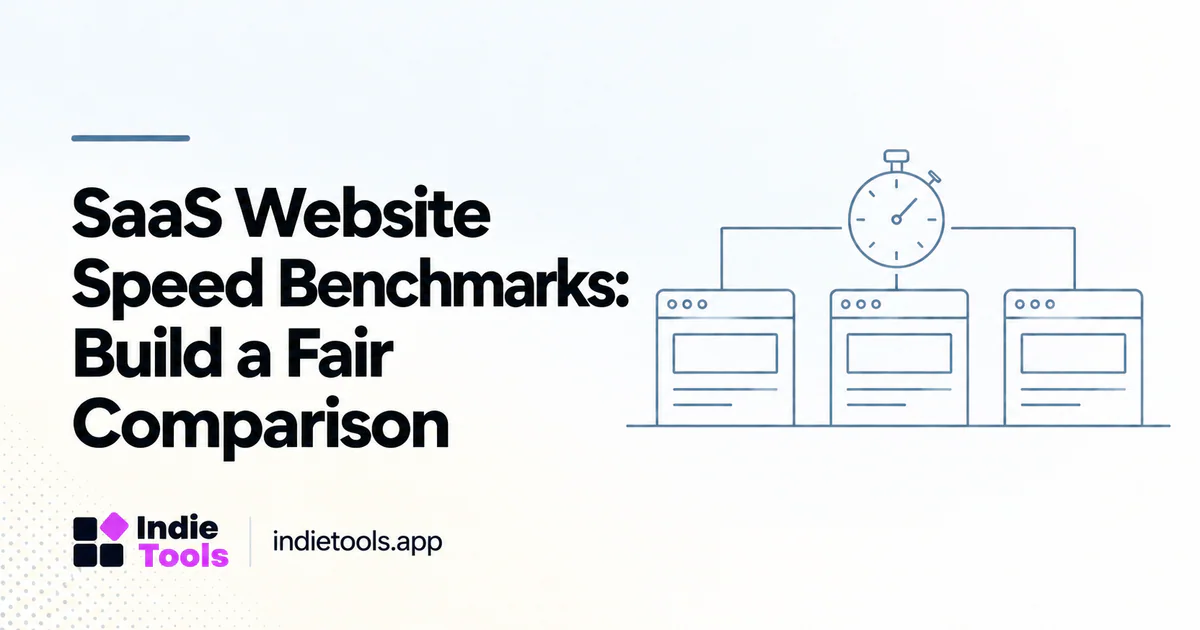
A useful SaaS website speed benchmark compares similar pages under similar conditions. It does not put a public marketing homepage, an authenticated analytics dashboard, and a video editor into one table and declare the lowest number the winner. Start with the decision you need to make: whether your acquisition pages are competitive, whether a release caused a regression, or which implementation deserves a closer technical look.
IndieTools Speed is a starting point for discovering dated mobile lab observations. Use the board to find peers, then verify the measured URL and the underlying metrics before drawing conclusions. [1]
Define the peer group before looking at the winners
Choose a product category and a page purpose. A practical first cohort might be public homepages for self-serve analytics products. Another might be pricing pages for developer tools. Keep those groups separate even when both contain SaaS businesses. The visitor is doing a different job, and the pages may contain different resources.
Write down inclusion rules in plain language. For example: public product website, identifiable primary domain, functioning response, mobile test, and a measurement captured during the same review window. Record exclusions too. A blocked test is not a zero score, and a missing result is not evidence that the website is slow.
Do not choose only competitors that make your own result look strong. Include the products a prospective customer would realistically evaluate. A small, well-described cohort is more useful than a large list assembled from unrelated brands.
Keep measurement scope visible
PageSpeed Insights separates lab diagnostics from real-user data. Treat those as different evidence sources rather than interchangeable measurements. [2]
For each observation, retain the requested URL, final URL, device profile, collection date, test type, and relevant metric values. An origin-level field result should not silently replace a missing URL-level observation. Similarly, a homepage lab score should not be labelled as the performance of the entire application.
A benchmark table can use this structure:
| Field | Why it belongs in the comparison |
|---|---|
| Product and measured URL | Identifies what was actually tested |
| Device and test type | Prevents mixed-condition comparisons |
| Measurement date | Makes freshness visible |
| Performance score | Provides a compact lab summary |
| LCP, CLS and blocking diagnostics | Shows where the experience differs |
| Status or exclusion reason | Preserves missing-data context |
The table should help a reader inspect the evidence, not merely display a badge.
Prefer distributions to a single impressive number
Suppose, in an illustrative six-site cohort, five products have similar load measurements and one has an unusually slow result. The mean could move substantially because of that outlier. A median plus the observed range makes the shape easier to understand. These are example reporting choices, not measured IndieTools statistics.
Keep the denominator attached to every summary. “Median of six eligible homepages” is a different claim from “median of all SaaS websites.” If you only inspected the visible top section of a leaderboard, describe that visible subset. Never turn a top-ranked sample into an industry average.
For small groups, show the individual observations rather than dressing a thin sample in statistical language. Readers can often learn more from a transparent ten-row table than from a headline claiming an industry-wide trend.
Connect the benchmark to an engineering decision
After finding a gap, inspect your own page. Is the delay before the document arrives, before the main visual appears, or after JavaScript begins executing? The benchmark tells you where to investigate; it does not identify the exact cause.
Choose one change with a plausible link to the slow stage. A hero image experiment, a deferred embed, and a server-response fix should be measured separately where possible. Changing all three at once may improve the page, but it makes attribution harder.
Then repeat your own measurement under the original conditions. Keep the original result, the new result, and the release identifier. A benchmark becomes valuable when it creates a testable improvement cycle instead of a weekly competition for screenshots.
Use a two-layer report
The public layer should be readable: cohort definition, dated table, brief interpretation, and limitations. The internal layer should preserve raw reports, failed runs, redirects, configuration, and release notes. This makes the public summary concise without hiding the information needed to reproduce it.
For IndieTools, keep the product page as the identity record and the Speed hub as the current comparison surface. An editorial benchmark article should explain a finding or a method that those pages do not already answer. Repeating the same ranking under a new blog URL adds little for readers.
Questions founders ask
Should every competitor have the same technology stack?
Not necessarily. For a customer-experience comparison, similar page purpose matters more than identical implementation. For a framework experiment, technology and deployment controls become part of the research design. State which question your benchmark answers.
Is a higher score always the next priority?
No. A score gap can be worth investigating, but the business decision should also consider the affected journey, reproducibility, maintenance cost, and whether the page still explains the product well. Do not remove useful content merely to create a cleaner test result.
Your next benchmark
Start with a compact, relevant peer set from IndieTools, preserve the measurement context, and publish only what the sample supports. The strongest benchmark is not the one with the largest number in its title. It is the one another founder can understand, check, and use to make a better decision.
Explore related IndieTools resources: product categories.
Continue your research
- Lighthouse Scores vs Real-User Experience
- Domain Rating Benchmarks for Early-Stage SaaS
- Build a Citation-Worthy SaaS Benchmark Dataset
Sources and verification
Sources consulted for this article on October 1, 2026. Product capabilities are documented claims unless an actual test is explicitly described.