Developer tools rarely have just one important website journey. A new visitor reads the homepage, an evaluator opens the documentation, and an active user searches for an error message or tries a code example. Testing only the landing page misses the routes that help developers reach a successful implementation.
Use the developer-tools category on IndieTools to discover relevant products, but build your performance review around page roles rather than the category label alone. The catalogue includes a developer-tools collection; it does not imply that every documentation route has been benchmarked. [1]
Build a route matrix around real tasks
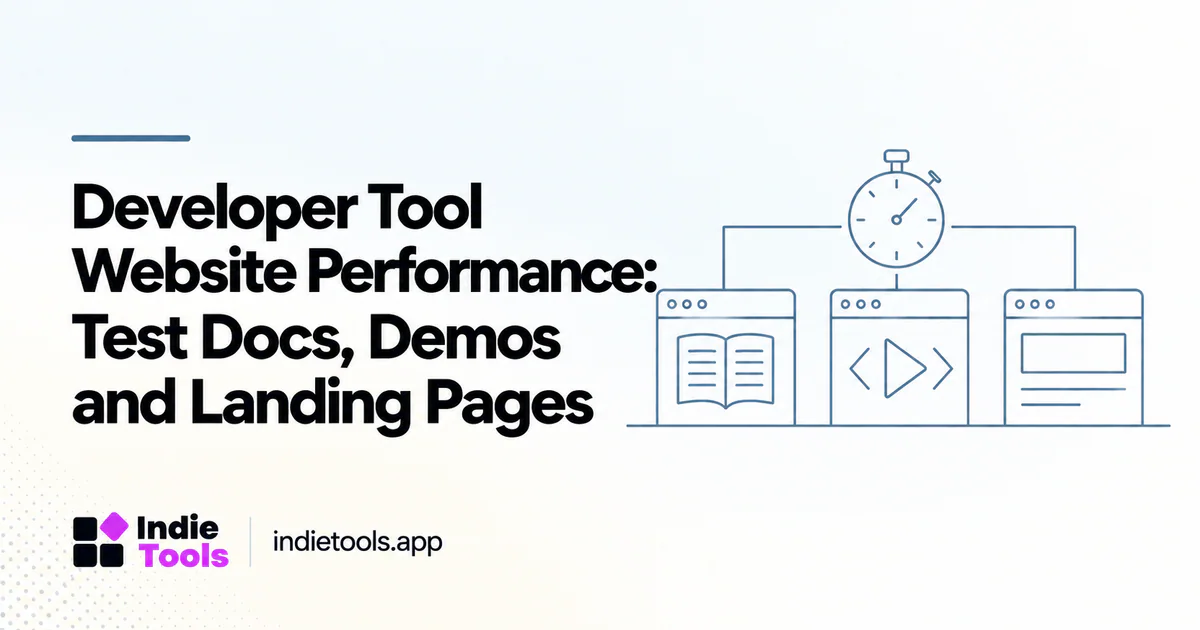
Start with four routes: the main product page, a getting-started guide, a representative API reference page, and a substantial tutorial. Add an interactive playground only when it is central to evaluation. The point is not to test every URL immediately. It is to cover different rendering and resource patterns.
For each route, write the task a developer wants to complete. “Read the authentication requirements” is more concrete than “visit the docs.” “Copy a working request” is more useful than “interact with the page.” These descriptions help you recognize when a technically fast page still creates friction.
Keep search and navigation in the matrix. A documentation site can load quickly and still make its most useful information difficult to find. The testing plan should capture both page delivery and the journey between pages.
Look for expensive documentation features
Syntax highlighting, embedded editors, search interfaces, diagrams, version selectors, and interactive examples can all deserve investigation. Do not remove them by default. Identify which are loaded before they are needed and which are essential to the first useful view.
A static code example and a runnable environment have different jobs. If the reader only needs to inspect a request, loading the entire execution environment at first paint may be unnecessary. If the product's value depends on running the example, delayed activation should still be obvious and accessible.
Use a trace to test the suspected bottleneck. The fact that a page contains a large code sample is not proof that the sample caused the delay. The investigation should connect a visible problem to a resource or processing stage.
Include interactions in the review
User-centric performance measurement asks when the page becomes useful, not just when a request completes. [2]
Try opening the version selector, expanding a navigation group, copying a code sample, and using search while the page is still loading. Record whether the interface responds and whether the action produces the expected result. A copied command with the wrong version is a documentation failure even if the copy button reacts instantly.
For an authenticated reference area, use an approved test account. Do not publish private endpoints, tokens, customer identifiers, or screenshots of internal data in a public performance report. Performance evidence should never require exposing operational secrets.
Compare like-for-like documentation pages
Avoid comparing a two-paragraph quickstart with a reference page containing hundreds of operations. Instead, define a representative task and choose routes with similar information needs. Report the differences that remain.
An illustrative comparison might distinguish:
| Page role | Main question |
|---|---|
| Marketing homepage | Can an evaluator understand the tool quickly? |
| Quickstart | Can a developer reach the first successful request? |
| API reference | Can the required parameter and response be found? |
| Tutorial | Can a reader follow the sequence without losing context? |
| Playground | Can the example run and recover from an error? |
No single metric answers every row. The matrix makes that limitation visible rather than hiding it behind an overall score.
Turn findings into a release-sized fix
Choose one change that fits a normal release. Examples include activating a playground on demand, simplifying a documentation layout, reducing redundant client initialization, or loading a heavy diagram only where it appears. Preserve a baseline so the result can be compared after deployment.
Test correctness alongside speed. A faster documentation page that drops code formatting, breaks anchors, or opens the wrong version is not an improvement. Include keyboard navigation and copying behavior in the acceptance test because these interactions matter to the reader's task.
Write the result as a narrow statement: which route changed, which conditions were used, and what improved. Avoid claiming that the whole product became faster because one marketing page scored better.
Keep directory and documentation evidence connected
A developer discovering a tool on IndieTools should be able to identify the product and continue to its current documentation. Your listing can describe the main use case and link to the canonical product website. The website can then make the quickstart, API reference, and support route easy to locate.
In a blog comparison, use the product page for identity and the tested documentation URL for performance evidence. That separation prevents a homepage result from being accidentally attributed to an unrelated subdomain or documentation platform.
Questions for a small team
How many documentation pages should be tested first?
Begin with representative page roles and your most important evaluator task. Expand when you discover distinct templates or recurring failures. There is no universal route count that guarantees coverage.
Should the playground be removed to improve the score?
Not automatically. Compare its value with its loading cost, then test on-demand activation or a lighter first view. The goal is to help a developer succeed, not to make the website look simpler than the product really is.
Explore related IndieTools resources: weekly website speed measurements.
Continue your research
- API Documentation Tools for Small Teams
- SaaS Landing Page vs App Performance
- Performance Regression Tests for SaaS Releases
Sources and verification
Sources consulted for this article on October 1, 2026. Product capabilities are documented claims unless an actual test is explicitly described.