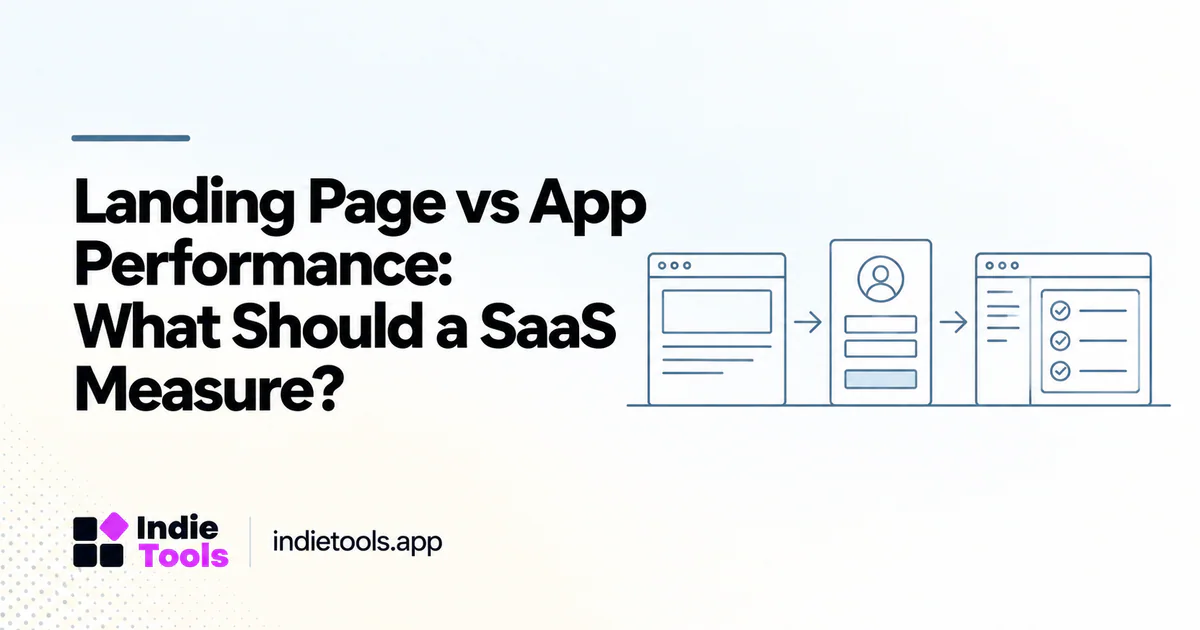
A SaaS landing page helps someone decide whether to try the product. The application helps that person complete a task. Both need to work well, but they should not share an undefined “speed” score. Build a measurement plan that follows the journey from first visit to first useful result.
A public performance directory is most useful when its measured scope is clear. IndieTools Speed provides website observations; your own application testing should cover the private workflows a public crawler cannot evaluate. [1]
Separate acquisition from activation
For acquisition, the visitor needs to understand the offer, inspect the relevant proof, and reach the next step. For activation, the user needs to complete a meaningful action inside the product. The resources, state, and backend work involved can be very different.
Define a success event for each stage. On a marketing route, it may be reaching a usable pricing comparison. Inside an analytics tool, it may be opening a populated report. Inside a writing application, it may be saving a usable draft. Avoid measuring only the easiest event, such as displaying a loading indicator.
This distinction also helps teams avoid misleading claims. A fast marketing homepage is not evidence that a large customer workspace loads quickly.
Choose representative application states
An empty test account can make an application appear simpler than the version customers use. Test with a realistic amount of permitted sample data. Include at least one state that exercises the main list, dashboard, or editor the product is built around.
Do not use production customer data casually. Create a controlled dataset or an approved test tenant. The measurement should be repeatable without exposing confidential information or depending on a particular customer's private workspace.
Document the state with the result. “A report with the standard evaluation dataset” gives a future reviewer more context than “dashboard tested.” When the dataset changes, record the change so the history remains interpretable.
Measure transitions, not only initial loads
After the first page arrives, the user may open a workspace, apply a filter, switch a view, or submit a form. Interaction responsiveness deserves its own inspection. Google's INP guidance concerns responsiveness during a page visit, not just initial loading. [2]
For each critical action, note when the user receives feedback and when the requested work is actually complete. A button can react immediately while the underlying job remains slow. Conversely, a fast backend response can still feel poor if the interface fails to acknowledge the click.
Keep these events separate in your test notes. That makes it easier to identify whether the next improvement belongs in the browser, the server, the job queue, or the interaction design.
Build a compact measurement matrix
A small team can start with a matrix rather than a complex performance platform:
| Journey stage | Representative test | Success condition |
|---|---|---|
| Discovery | Public homepage | Main offer is understandable and usable |
| Evaluation | Pricing or demo route | Visitor can inspect relevant options |
| Entry | Signup or login | User reaches the expected state safely |
| First value | Core product workflow | Useful result is completed correctly |
| Return visit | Existing workspace | Prior work is available and responsive |
| Recovery | Controlled failure | User receives clear feedback and can continue |
The table is a proposed test design. It is not a claim that a single score measures all of these outcomes.
Decide what belongs in public reporting
Public comparisons should use evidence that can be described and checked without exposing private systems. A homepage lab report can be public. An authenticated benchmark may require a documented test account, a disclosed dataset, and a repeatable task.
When those conditions are unavailable, describe the workflow qualitatively and keep the numerical claim narrow. Do not imply that a tool has been hands-on tested merely because its public listing was reviewed.
On IndieTools, the product page can connect discovery information with dated website evidence. An editorial guide can explain how to evaluate the remaining application questions. These surfaces complement each other when they do different jobs.
Prioritize the bottleneck that blocks value
Imagine an illustrative product whose homepage is already consistently responsive, but whose first report takes too long to become useful. Spending another week polishing the homepage score may be less valuable than investigating the report workflow. The example is a decision framework, not a measured conversion claim.
Choose the next task based on observed friction, the number of affected journeys, reproducibility, and implementation risk. Keep important security and correctness checks in place. Performance work should make the product easier to use without weakening its behavior.
After a change, repeat the same task with the same state. Record what improved and what did not. A clear partial improvement is more useful than an exaggerated claim that the whole application is now fast.
Questions to settle with the team
Can one dashboard summarize everything?
It can summarize the evidence, but it should preserve separate measures and scopes. A single blended number can hide the route or task that needs attention.
Which should be tested first?
Start with the journey that matters most to the current product stage, while keeping a basic check on the other stages. A launch needs an effective entry path; a growing product also needs reliable repeat use.
Explore related IndieTools resources: product categories.
Continue your research
- Reduce Signup Latency Without Removing Security
- Fast Homepage, Slow Pricing Page: An Audit Guide
- Developer Tool Performance: Docs, Demos and Pages
Sources and verification
Sources consulted for this article on October 1, 2026. Product capabilities are documented claims unless an actual test is explicitly described.