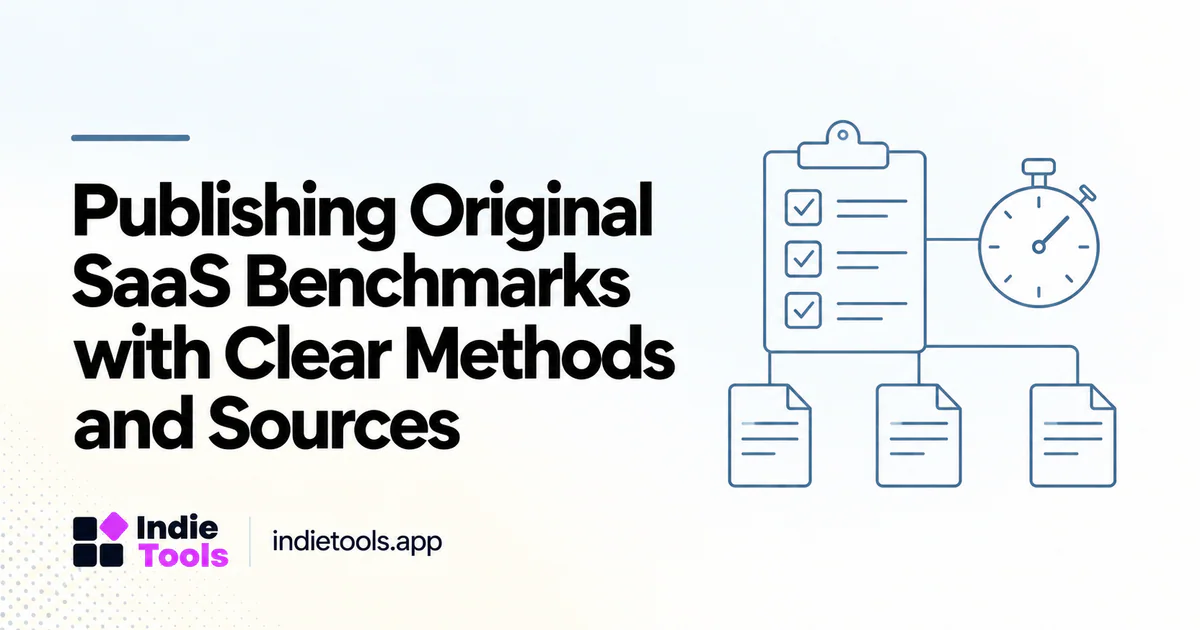
An original SaaS benchmark should let a reader understand the question, the eligible sample, the measurement process and the limits of the conclusion. A striking headline is not enough if the underlying comparison cannot be reconstructed.
For a directory such as IndieTools, the strongest opportunity is to turn properly scoped observations into useful explanations. That requires a report built around available evidence, not a broad industry claim reverse-engineered from a convenient leaderboard.
Define one answerable research question
Start with a question that the data can actually address. “How did public landing-page LCP change within a stable group over four observations?” is narrower than “Which technology is fastest?” The broader question may involve hosting, design, caching and sampling differences that a directory label cannot resolve.
Write the planned conclusion format before calculating the result. It should include the population and conditions. This reduces the temptation to expand the claim after finding an interesting number.
Freeze the eligible sample and explain exclusions
Record the inclusion date, required fields and reasons a product may be excluded. Examples include an unreachable page, an incompatible test mode or a URL representing a shared platform rather than the product's own domain.
If the report uses a changing sample, describe that change. Otherwise, an apparent improvement may reflect slower products disappearing rather than existing products becoming faster. Keep exclusions available for review without publishing unnecessary personal information.
Describe the method in operational terms
Explain what was measured, which provider or tool supplied it, the relevant settings and how repeated observations were handled. PageSpeed Insights distinguishes laboratory and field information, so the report should identify which evidence it uses. [1]
IndieTools' Speed page documents its own weekly measurement context. [2] A report using those observations should retain that context rather than implying a continuous real-user performance study. Missing field data should remain missing, not be replaced with laboratory values under the same label.
Separate descriptive results from causal claims
A descriptive result says what happened in the observed sample. A causal claim says why it happened. The second requires additional evidence.
For example, products reporting a particular framework may have a different median score in a sample. That alone does not establish that the framework caused the difference. Page complexity, product maturity and hosting choices may vary simultaneously. Discuss those alternatives rather than attaching a definitive technology verdict to an uncontrolled comparison.
Publish enough material for verification
Include definitions, sample size, observation dates and a usable explanation of calculations. Provide a downloadable, appropriately licensed dataset when it can be shared safely and lawfully. Google's Dataset structured-data documentation describes a separate discovery format for genuine datasets; it is not a reason to mark an ordinary article as a dataset. [3]
A reader should be able to locate the source table and understand the transformation from rows to claims. An unexplained chart image is insufficient for that purpose. Keep the public report readable without forcing every visitor to inspect the raw data.
Design the report for correction
Assign a report version and record substantive corrections. If an eligibility error changes the headline number, explain what changed rather than silently replacing the value everywhere. Retain a clear distinction between a historical release and the latest live leaderboard.
End with implications that fit the evidence: a measurement worth repeating, a segment requiring more observations or an implementation question for further testing. A careful unresolved question can be more useful than a confident claim the dataset cannot support.
Frequently asked questions
How many products are enough for a benchmark?
There is no universal publication threshold. It depends on the claim, variation and intended analysis. State the sample and avoid generalizing beyond what it supports.
Can a directory leaderboard become a research report?
Yes, when its scope, selection and measurement conditions are preserved. It should not be presented as a representative industry census without additional evidence.
Should a report be published before the data is available?
Publish a methodology guide as a methodology guide. Do not label it a completed study or invent results to fill the planned report structure.
Explore related IndieTools resources: Domain Rating leaderboard.
Continue your research
- Build a Citation-Worthy SaaS Benchmark Dataset
- Report Website Speed Improvements Honestly
- Data Tables Humans and Answer Engines Can Read
Sources and verification
Sources consulted for this article on October 1, 2026. Product capabilities are documented claims unless an actual test is explicitly described.