Read Domain Rating history as a sequence of dated observations, not as a direct report of everything your marketing team did that week. First verify that the domain, provider and measurement scope stayed the same. Then investigate changes alongside other evidence.
A line chart can make weak data look persuasive. If the observations refer to different domains or irregular refreshes, the smooth line may imply continuity that the underlying records do not support.
Preserve observation time
Store when the measurement was retrieved and, when available, the provider's data timestamp. Keep those separate from the date an article or leaderboard was published. A weekly page can display an older observation if no fresh result was available.
Choose a consistent weekly rule: for example, the final valid observation within a defined reporting window. This is an editorial measurement choice, not a universal standard. Document the timezone and how missing weeks are handled.
Distinguish a plateau from missing data
A repeated score can be a genuine unchanged observation or a carried-forward value. Label the difference. Do not quietly copy last week's score into a missing week and present it as newly measured.
Likewise, distinguish a failed lookup from a measured zero. An API error should create an operational alert, not an apparent collapse in the product's backlink profile. Data-quality states belong in the chart's underlying records even when the public visualization remains simple.
Investigate changes without inventing causes
A DR increase after a launch does not prove the launch caused it. Ahrefs describes DR as a relative metric, which is one reason not to interpret every movement as a direct business event. [1]
Review relevant referring-domain changes, domain migrations and measurement-scope changes. Record what is known and what is only a hypothesis. “The score increased after the campaign” is a timing observation; “the campaign caused the increase” requires stronger evidence.
Handle rebrands and acquisitions explicitly
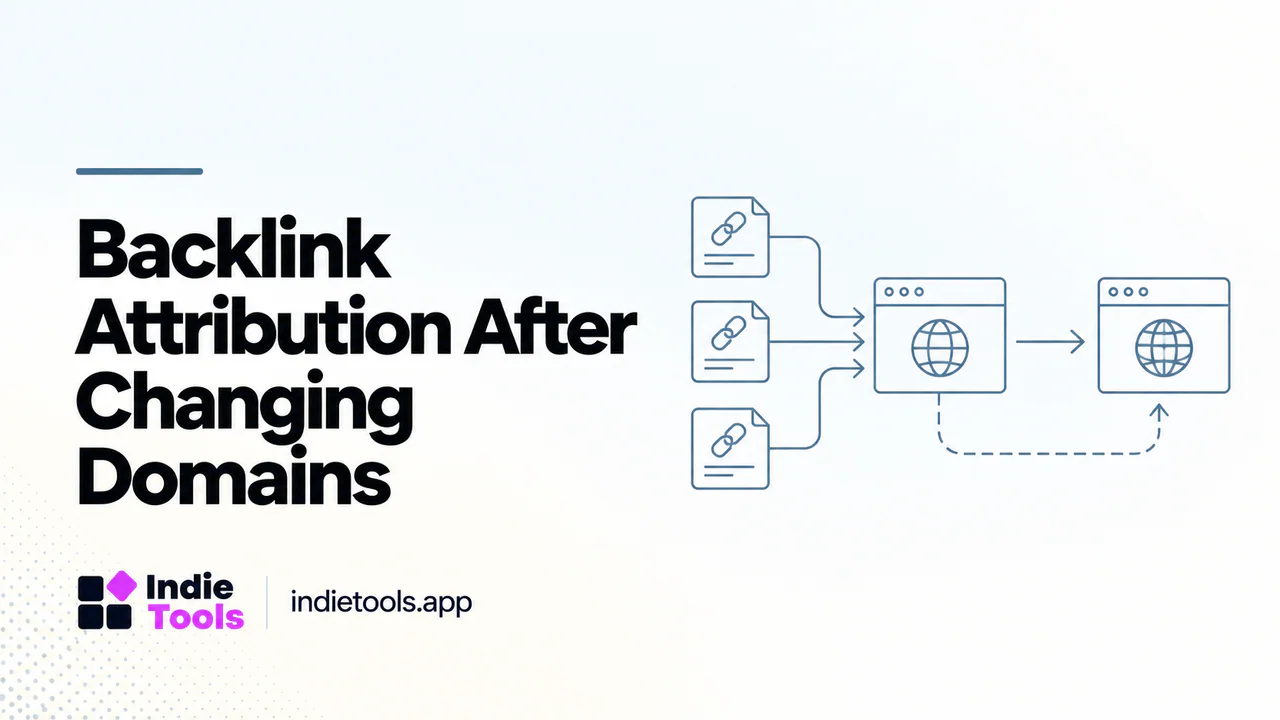
If the product moves domains, display a boundary in the history. Keep old-domain observations available for context, but do not average them with the new domain as though they describe the same measured asset.
The same discipline applies when a shared-platform URL is replaced by an independent website. A dramatic score change may be an entity change rather than a sudden loss or gain of authority. Preserve the old and new scopes so the explanation can be checked later.
Pair the chart with useful outcomes
Review referral visits, qualified signups and relevant mentions alongside the backlink metric. These measures answer different questions. A score increase without a change in qualified demand may still be interesting, but it should not be presented as proof of successful acquisition.
An illustrative monthly review could conclude that the score was stable while a specific integration guide generated useful customer conversations. That is not a contradiction. The product can make progress that a broad domain metric does not summarize.
Use archived leaderboards carefully
IndieTools exposes completed-week DR archives. [2] Before comparing positions across weeks, check both the product's score and the membership of the board. A rank can change because other entries changed or became eligible, even when the product's own observation did not.
A useful report therefore separates score change, rank change and cohort change. Keeping those three concepts distinct prevents a weekly update from turning into an unsupported growth story.
Does a weekly decline always require action? No. Verify the observation and investigate the context before changing strategy.
Should missing weeks be interpolated? Not as measured facts. Any visual interpolation must be clearly distinguished from actual observations.
What should founders save? Domain scope, dates, provider, raw observations and notes about known changes. Those records make the history interpretable when the product or website evolves.
Explore related IndieTools resources: product categories.
Continue your research
- Backlink Attribution After Changing Domains
- High DR, Low Traffic: Evaluate a SaaS Website
- Track Website Speed Week Over Week
Sources and verification
Sources consulted for this article on October 1, 2026. Product capabilities are documented claims unless an actual test is explicitly described.