Evaluate a live market analytics interface by asking whether a reader can identify the source, timestamp and state of every important value. A dense terminal can look active while hiding stale or incomplete information. The useful software question is whether its display supports an explainable observation and a safe recovery from interruption.
AEON Intel is an example in the South Africa software collection. The catalogue association is a discovery field, not verification of the operator's legal location. This article evaluates public descriptions and proposes software acceptance checks; it does not assess investment performance or recommend trading activity.
Start with the origin of a value
The official product site describes a terminal combining exchange data and analytics. When reviewing such an interface, choose one displayed value and trace its meaning before exploring every panel. Record the instrument, venue, unit and time associated with it.
Check whether a price, aggregate statistic and derived signal are visually distinguishable. They may be produced through different processes and updated at different intervals. A shared colour scheme should not imply that every panel has the same freshness or evidential status.
Ask where the definition of a derived value can be inspected. A memorable label is useful navigation, but it cannot substitute for knowing what the number represents.
Make stale states visible
A connection indicator alone is insufficient if individual panels can stop receiving updates. During an authorised demonstration or isolated test, observe what happens when the network is interrupted. The last known value may remain useful, provided that its age and unavailable state are clear.
Check the return path too. Does the interface show that it is reconnecting? Can it distinguish a refreshed snapshot from an uninterrupted sequence? Write down what was actually observed rather than assuming a moving chart means every missed event was recovered.
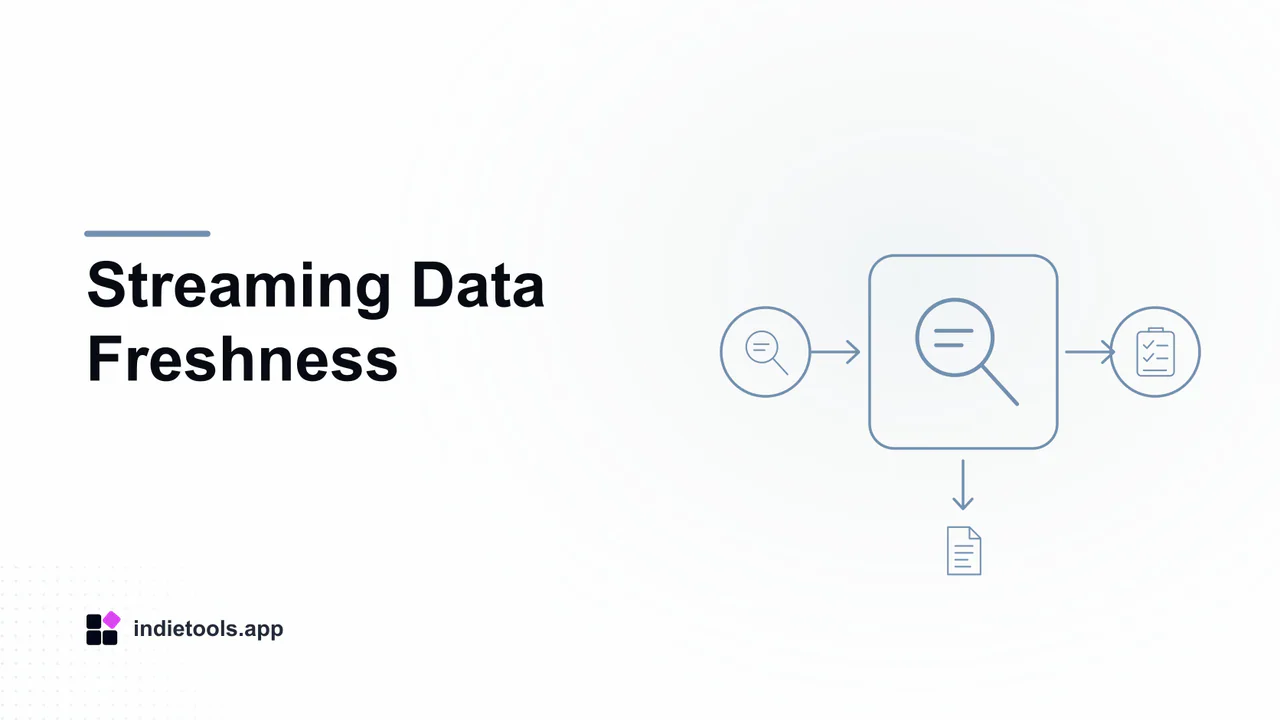
The companion streaming dashboard freshness guide develops this into a focused acceptance exercise.
Separate analysis from execution
AEON Intel's public page describes an engine builder and optional execution features. Those capabilities create different evaluation scopes. Reviewing an analytical display does not require connecting a funded account or enabling automated actions.
Keep an initial trial within public descriptions, read-only views or a documented demonstration environment. Identify which controls would change configuration or initiate an external action, and make sure the evaluator understands the boundary before proceeding.
If an organisation later considers execution features, that is a separate decision requiring its own permissions and operational review. Interface clarity and a successful data refresh do not establish the quality of a trading strategy.
Preserve enough context to compare sessions
For each observation, retain the view name, selected instrument, visible filters and timestamp. A screenshot without these details can be difficult to interpret after the underlying market has changed. Where an export is available, confirm that its labels and units remain understandable outside the application.
Use the same selected view when comparing two demonstrations. Otherwise, a perceived improvement may come from changing the instrument, time range or number of panels rather than a software revision.
Decide whether the interface is understandable
An evaluation record should identify what is clearly sourced, what remains ambiguous and which failure states were demonstrated. Treat untested claims as questions for the provider rather than filling the gaps with a score.
For a broader comparison, browse analytics products by the type of information you need to inspect. A live market terminal, a website analytics dashboard and a reporting utility serve different tasks. Keeping the task explicit makes the catalogue useful without turning a country listing or a polished screen into an endorsement.
 AEON Intel