Analyze technology adoption in a product directory by defining what the records can actually represent. A founder-reported catalog can describe its own disclosed stack patterns, but it is not automatically a representative survey of all startups or all software in production.
The strongest analysis keeps the denominator, missing fields and overlapping technologies visible. Those details determine whether a percentage is meaningful.
Define the eligible population
Choose the catalog snapshot and the product types included. Decide whether services, courses, templates and software applications belong in the same analysis. If the headline says “SaaS,” the eligibility rules need to support that description.
Record total eligible products, products with any stack disclosure and products with the specific field being analyzed. A missing technology field is not evidence that the product does not use a technology.
Separate taxonomy from adoption
A directory can support many technology labels without having products attached to every label. IndieTools' technology page distinguishes its available entries from those with products to browse. [1] Count disclosed product relationships rather than treating the taxonomy size as evidence of real-world usage.
Preserve the observation date. New submissions, corrections and removed products can change the counts without any existing founder changing their stack.
Handle overlapping labels
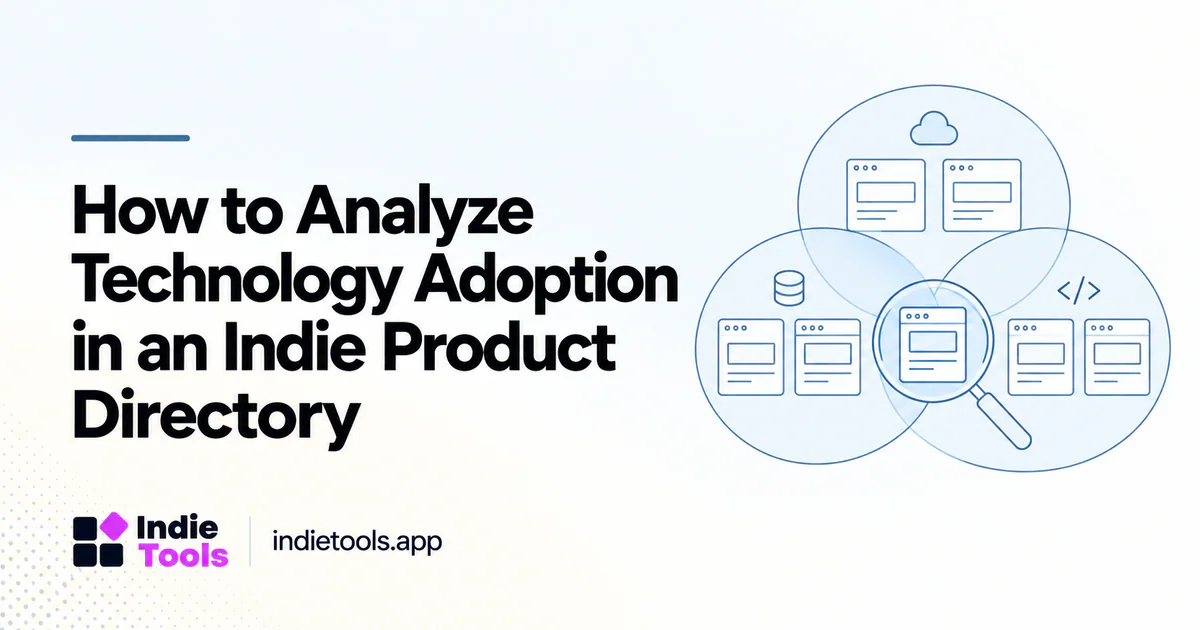
Some labels describe related layers rather than mutually exclusive choices. A product can declare both React and Next.js, or a database platform alongside its underlying database. Summing those categories into a single market-share total would double-count products.
Choose the question carefully. “Products declaring each technology” can allow overlap and should say so. “Primary frontend framework” requires a separately defined field and a rule for products with several interfaces. Do not infer a primary technology merely from the order of tags.
Choose the unit of analysis
Product-level and founder-level counts answer different questions. One founder with several similar products can contribute many records to a product-level chart. That may be correct for the catalog question but misleading for a claim about how many independent founders choose a stack.
When possible, report both product and unique-founder coverage. Keep uncertain ownership relationships separate rather than guessing that similarly named profiles belong to the same person.
Analyze co-occurrence responsibly
A co-occurrence table can show which technologies are declared together. It cannot prove an integration pattern, causal advantage or preferred architecture. A label may refer to the marketing site while another refers to the application backend.
An illustrative finding might be that several disclosed products list both a frontend framework and a particular database service. The appropriate conclusion is a catalog pattern worth investigating, not that the combination causes faster launches or higher revenue.
Publish limitations beside the result
Explain self-selection, incomplete disclosure, classification rules and duplicate handling. Avoid hiding all methodological caveats in a footer while the headline makes a universal claim. A narrower headline such as “Declared Stacks in This IndieTools Snapshot” is more defensible than “What Every Indie Founder Uses.”
Provide a data dictionary and versioned observations when publishing a reusable dataset. Google's Dataset documentation is relevant when an actual dataset landing page is being created. [2] It does not turn an unsupported claim into a valid study.
Turn the analysis into useful content
Use the findings to identify examples for deeper interviews, architecture guides or workflow comparisons. Ask founders why they made a choice and which tradeoffs appeared later. Those follow-up explanations can add value that a count table cannot provide on its own.
Can tag counts be called market share? Not without a population and sampling method that support that claim.
Should missing declarations count as “not used”? No. Treat them as unknown.
What makes the analysis worth publishing? A clear question, a valid denominator and a result that helps readers investigate real product decisions without overstating the coverage of the directory.
Explore related IndieTools resources: product categories.
Continue your research
- Country and Technology Filters for Product Research
- Build a Citation-Worthy SaaS Benchmark Dataset
- SaaS Built with Next.js: Research Real Examples
Sources and verification
Sources consulted for this article on October 1, 2026. Product capabilities are documented claims unless an actual test is explicitly described.